26 releases
| new 0.1.0-rc.0 | May 6, 2024 |
|---|---|
| 0.1.0-beta.3 | May 5, 2024 |
| 0.1.0-alpha.7 | Apr 30, 2024 |
| 0.0.5 | Feb 29, 2024 |
| 0.0.2 | Oct 27, 2023 |
#41 in Debugging
944 downloads per month
3.5MB
6K
SLoC
tracexec
A small utility for tracing execve{,at} and pre-exec behavior.
tracexec helps you to figure out what and how programs get executed when you execute a command.
It's useful for debugging build systems, understanding what shell scripts actually do, figuring out what programs does a proprietary software run, etc.
Warning: You are viewing the documentation for the upcoming 0.1.0 release. The current stable release is 0.0.5.
Showcases
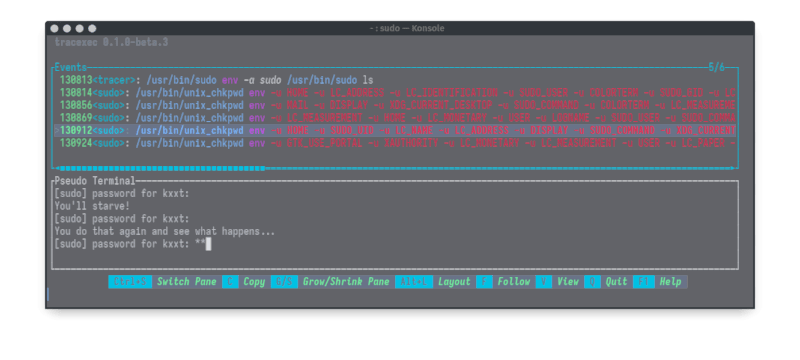
TUI mode with pseudo terminal
In TUI mode with a pseudo terminal, you can view the details of exec events and interact with the processes within the pseudo terminal at ease.
Tracing setuid binaries
With root privileges, you can also trace setuid binaries and see how they work. But do note that this is not compatible with seccomp-bpf optimization so it is much less performant.
sudo tracexec --user $(whoami) tui -t -- sudo ls
Default mode
By default, tracexec will print filename, argv and the diff of the environment variables.
example: tracexec log -- bash (In an interactive bash shell)

Reconstruct the command line with --show-cmdline
$ tracexec log --show-cmdline -- <command>
# example:
$ tracexec log --show-cmdline -- firefox

Show the interpreter indicated by shebang with --show-interpreter
And show the cwd with --show-cwd.
$ tracexec log --show-interpreter --show-cwd -- <command>
# example: Running Arch Linux makepkg
$ tracexec log --show-interpreter --show-cwd -- makepkg -f

Installation
From source
Via cargo:
cargo install tracexec
You can also install tracexec from AUR.
Binary
You can download the binary from the release page
You can also install tracexec-bin from AUR.
Usage
Run tracexec in logging mode

Usage: tracexec log [OPTIONS] -- <CMD>...

Arguments:
  <CMD>...  command to be executed

Options:
      --successful-only            Only show successful calls
      --show-cmdline               Print commandline that reproduces what was executed. Note that when filename and argv[0] differs, it probably won't give you the correct commandline for now. Implies --successful-only
      --show-interpreter           Try to show script interpreter indicated by shebang
      --more-colors                More colors
      --less-colors                Less colors
      --show-children              Print a message when a child is created
      --seccomp-bpf <SECCOMP_BPF>  seccomp-bpf filtering option [default: auto] [possible values: auto, on, off]
      --diff-env                   Diff environment variables with the original environment
      --no-diff-env                Do not diff environment variables
      --show-env                   Show environment variables
      --no-show-env                Do not show environment variables
      --show-comm                  Show comm
      --no-show-comm               Do not show comm
      --show-argv                  Show argv
      --no-show-argv               Do not show argv
      --show-filename              Show filename
      --no-show-filename           Do not show filename
      --show-cwd                   Show cwd
      --no-show-cwd                Do not show cwd
      --decode-errno               Decode errno values
      --no-decode-errno
  -o, --output <OUTPUT>            Output, stderr by default. A single hyphen '-' represents stdout.
  -h, --help                       Print help
The recommended way to use tracexec is to create an alias with your favorite options in your bashrc:
alias tracex='tracexec log --show-cmdline --show-interpreter --show-children --show-filename --'
# Now you can use
tracex <command>
Known issues
- Non UTF-8 strings are converted to UTF-8 in a lossy way, which means that the output may be inaccurate.
- The output is not stable yet, which means that the output may change in the future.
- No tests yet.
Origin
This project was born out of the need to trace the execution of programs.
Initially I simply use strace -Y -f -qqq -s99999 -e trace=execve,execveat <command>.
But the output is still too verbose so that's why I created this project.
Credits
Dependencies
~21–37MB
~568K SLoC